Market Snapshots – Oct 2018

Metro Phoenix housing market continues doing well. All indicators are positive except the inventory getting lower.

  • Median Home Sales Price : $261,000 up 6.53%
  • Median Price per Square Foot : $151.00 up 7.86%
  • Sold above Asking Price : 16.4% up 3.8%
  • Median DOM : 41 down 4.65%
  • Inventory : 2.6 Months down 7.14%
  • Monthly Home Sales : 6,961 down 4.5%
  • New Listings : 8,211 down 8.5%

All % of changes are compared to Oct 2017.

Social Share Toolbar

Chandler Schools Top Public High Schools in Arizona

Based on 2016 SAT scores, these are the top 25 high schools and all 5 high schools in the Chandler Unified School District are on the list. They are highlighted below —

1. University High School: 1332, Tucson Unified
2. AZ College Prep-Erie Campus: 1285, Chandler Unified
3. Gilbert Classical Academy: 1284, Gilbert Unified
4. Hamilton High School: 1252, Chandler Unified
5. Flagstaff High School: 1236, Flagstaff Unified
6. Sunnyslope High School: 1228, Glendale Union
7. Catalina Foothills High School: 1216, Catalina Foothills Unified
8. Ironwood High School: 1201, Peoria Unified
9. Paradise Valley High School: 1207, Paradise Valley Unified
10. Perry High School: 1203, Chandler Unified
11. Desert Mountain High School: 1200, Scottsdale Unified
12. Chandler High School: 1194, Chandler Unified
13. DEsert Vista High School: 1191, Tempe Union
14. University High School: 1187, Tolleson Union
15. Deer Valley High School: 1187, Deer Valley Unified
16. Ironwood Ridge High School: 1187, Amphitheater Unified
17. Catcus High School: 1183, Peoria Unified
18. Empire High School: 1182, Vail Unified
19. Horizon High School: 1181, Paradise VAlley Unified
20. Lee Williams High School: 1181, Kingman Unified
21. Mountain View High School: 1181, Mesa Unified
22. Benson High School: 1179, Benson Unified
23. Red Mountain High School: 1178, Mesa Unified
24. Basha High School: 1177, Chandler Unified
25. Fountain Hills High School: 1176, Fountain Hills Unified

Social Share Toolbar

2019 Best School Districts in the metro Phoenix

The 2019 Best School Districts ranking is based on rigorous analysis of key statistics and millions of reviews from students and parents using data from the U.S. Department of Education. Ranking factors include state test scores, college readiness, graduation rates, SAT/ACT scores, teacher quality, public school district ratings, and more. Read more on how this ranking was calculated.

#1 Best School Districts in Phoenix Area – Chandler Unified School district #80

Here is the rest of the survey result …

Social Share Toolbar

East Valley Continues to Grow

East Valley sees more business hiring, relocations in the first half of 2018. Nearly 4,600 job announcements during the first half of the year, most of which are the result of companies choosing to relocate to the area.

Among them, Deloitte’s announcement of a $50 million capital investment in a 100,000-square-foot delivery center that will create up to 2,500 jobs in Gilbert and Wells Fargo’s aim to increase its Chandler workforce from 5,000 to 6,200 drove some of the largest increases. While AQST Space Systems, On Q Financial, San Francisco-based Bright Benefit Inc. and many others are hiring.

Social Share Toolbar

ARMLS Rent Check™ – August, 2018

For the month of August 2018, all RENT Check indicators indeed reached the plateau.

Median Lease: $1,495 – Remained at $1,495 level as previous month.
Average Lease: $1,670 – Decreased slightly from $1,679 previous month.
Avg. Days on Market: 26 – Increased again from 25 days of the previous month.
Closed Rental: 2,242 – Surprisingly, this indicator increased from 2,203 homes the previous month.

Rent Check Quotient™: 3:10 – Rental supplies remains flat as last month.

Rent Check Quotient™ (RCQ™) is the ratio of closed rentals and closed sales.

Every summer, June, July, and August are the peaks of the rental market whereas the housing market starts to cool down. We expect to see weaker Rent Check™ indicators to come.

Social Share Toolbar

ARMLS Rent Check™ – July, 2018

For the month of July 2018, all RENT Check indicators seem like reaching the plateau.

Median Lease: $1,495 – Increased slightly from $1,485 previous month.
Average Lease: $1,679 – Increased slightly from $1,670 previous month.
Avg. Days on Market: 25 – Increased slightly from 24 days of the previous month.
Closed Rental: 2,203 – Decreased slightly from 2,228 homes the previous month.

Rent Check Quotient™: 3:10 – Rental supplies remains flat as last month.

Rent Check Quotient™ (RCQ™) is the ratio of closed rentals and closed sales.

Every summer, June, July, and August are the peaks of the rental market whereas the housing market starts to cool down. We expect to see stronger Rent Check™ indicators to come.

Social Share Toolbar

ARMLS Rent Check™ – June, 2018

For the month of June 2018, all RENT Check indicators showed sustaining momentum comparing to the previous month, May 2018.

Median Lease: $1,485 – Increased from $1,450 previous month.
Average Lease: $1,670 – Increased from $1,616 previous month.
Avg. Days on Market: 24 – Decreased from 25 days of the previous month.
Closed Rental: 2,228 – Increased from 1,903 homes the previous month.

Rent Check Quotient™: 3:10 – Rental supplies improved from 1:5 last month.

Rent Check Quotient™ (RCQ™) is the ratio of closed rentals and closed sales.

Every summer, June, July, and August are the peaks of the rental market whereas the housing market starts to cool down. We expect to see stronger Rent Check™ indicators to come.

Social Share Toolbar

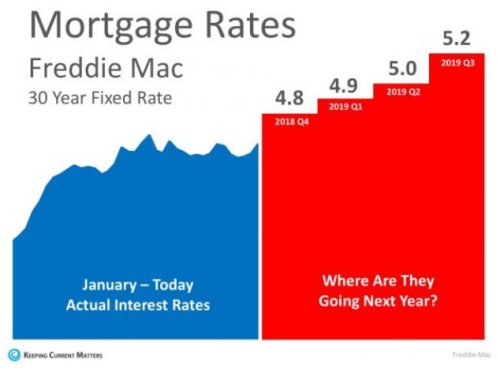
Mortgage Interest Rate Trending Up

Below is a chart created using Freddie Mac’s U.S. Economic & Housing Marketing Outlook. As you can see, interest rates are projected to increase steadily over the course of the next year. Mortgage Rates Trending High into 2019

Social Share Toolbar